Interactive mouth map data
Helping us tell the stories of the positive effect of sodium bicarbonate toothpaste
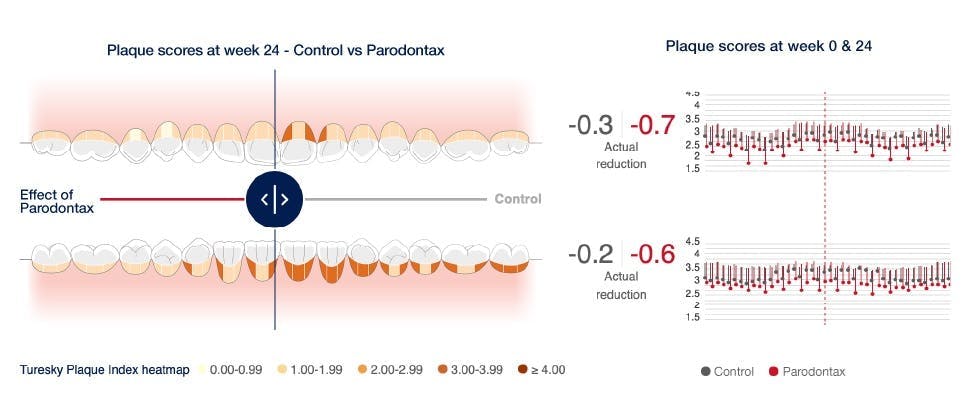
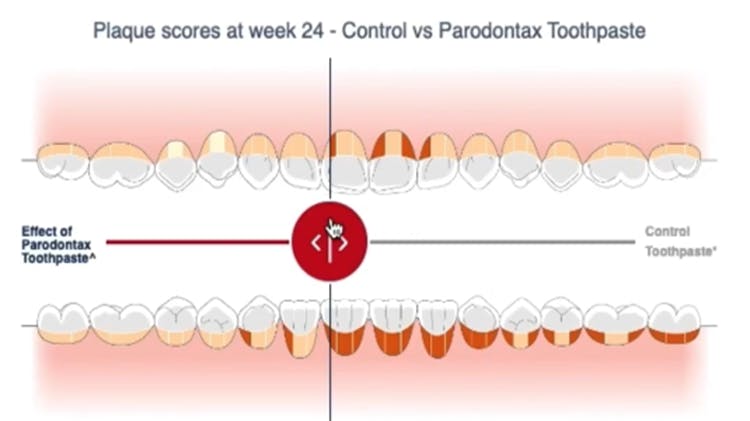
This mouth map visualisation is a world first interactive tool. As a clinician you are in control of how the data is presented, and rather than tables of charts we have worked to visualise data around the mouth. The aim is to simplify highly complex data to make it intuitive and engaging whilst remaining rooted in good clinical science.
See how it works for yourself by accessing the mouth map on the link below.
- Choose between the mouth visual view or dental charting view
- Choose palatal/lingual or upper/lower facial views
- Select plaque, bleeding index or inflammation measures
- Slide the scale to adjust between test formulations across dental sites.
As part of our continued drive for trusted science, we wanted to create a first in class mouth map that demonstrates sodium bicarbonate effect on every point in the mouth vs. a regular non sodium bicarbonate toothpaste.
Watch our short videos to hear from some of the team involved in this unique science visualisation project.
Access the interactive tool below to explore the data for yourself.
Expert talks on science visualisation project
The science behind the data
Scientist Charlie Parkinson from Haleon outlines the pooled analysis data and highlights the additional insights provided by the visualisation of the mouth map.
Visualising the science
David Davenport-Firth of Ogilvy Health UK discusses why the visualization of science is so important and the key principles adopted in its application.
Optimising the user experience
Designer Steve Binding highlights the key challenges associated with the mouth map which combines simplified visuals with dental charting.
Explore more resources on parodontax toothpaste

The science of sodium bicarbonate
Interact with the science of sodium bicarbonate, which demonstrates how it enhances patients daily brushing, by softening and removing plaque, improving gingivitis outcomes.
parodontax toothpaste
parodontax fluoride toothpaste formulations have been developed to partner with your daily oral hygiene advice and work to enhance the plaque removal achieved versus brushing with a standard non-sodium bicarbonate toothpaste.
parodontax Interactive Mouth Map Tool
This interactive tool allows you to visualise the clinical efficacy data for parodontax.